Have you ever wondered who is the biggest most successful auto manufacturer in the world or what region of the world makes the most cars?
We regularly hear about Toyota, Volkswagen, GM, Ford, Stellantis, Hyundai and Tesla fighting it out for automotive supremacy but then we hear of companies like Geely, BYD, Subaru and Renault but don’t really know where they fit into the global automotive market.
We also hear that South Korea, India and China have had massive increases in their automotive manufacturing capacities, but don’t really understand where they are relative to Europe, Japan, and the United States.
The simple graphs and tables below clarify all of these points and give you an easy way to understand the global automotive market in the mid-2020’s
Here are the raw statistics if you prefer your numbers in a table format
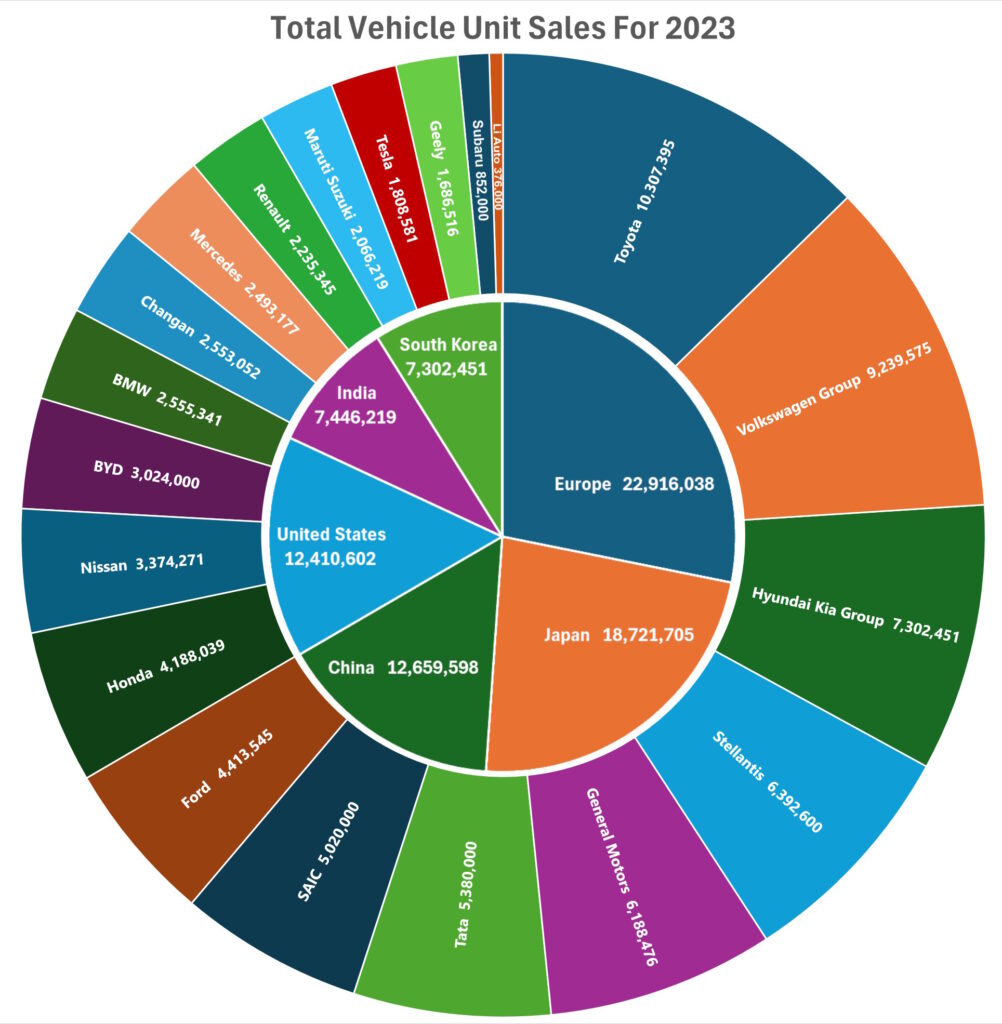
Top 20 Automotive Manufactures By Unit Sales in 2023
| Rank | Company | Country | Unit Sales |
| 1 | Toyota | Japan | 10,307,395 |
| 2 | Volkswagen Group | Europe | 9,239,575 |
| 3 | Hyundai Kia Group | South Korea | 7,302,451 |
| 4 | Stellantis | Europe | 6,392,600 |
| 5 | General Motors | United States | 6,188,476 |
| 6 | Tata | India | 5,380,000 |
| 7 | SAIC | China | 5,020,000 |
| 8 | Ford | United States | 4,413,545 |
| 9 | Honda | Japan | 4,188,039 |
| 10 | Nissan | Japan | 3,374,271 |
| 11 | BYD | China | 3,024,000 |
| 12 | BMW | Europe | 2,555,341 |
| 13 | Changan | China | 2,553,052 |
| 14 | Mercedes | Europe | 2,493,177 |
| 15 | Renault | Europe | 2,235,345 |
| 16 | Maruti Suzuki | India | 2,066,219 |
| 17 | Tesla | United States | 1,808,581 |
| 18 | Geely | China | 1,686,516 |
| 19 | Subaru | Japan | 852,000 |
| 20 | Li Auto | China | 376,030 |
Total Auto Sales By Country in 2023
| Rank | Country | Unit Sales For 2023 |
| 1 | Europe | 22,916,038 |
| 2 | Japan | 18,721,705 |
| 3 | China | 12,659,598 |
| 4 | United States | 12,410,602 |
| 5 | India | 7,446,219 |
| 6 | South Korea | 7,302,451 |
| Total Vehicle Production From the Top 20 Vehicle OEMs | 81,456,613 |
Top 20 Car Manufacturers by Sales in 2023
Figures in billions of USD $
Subject to Currency Exchange Rate Fluctions
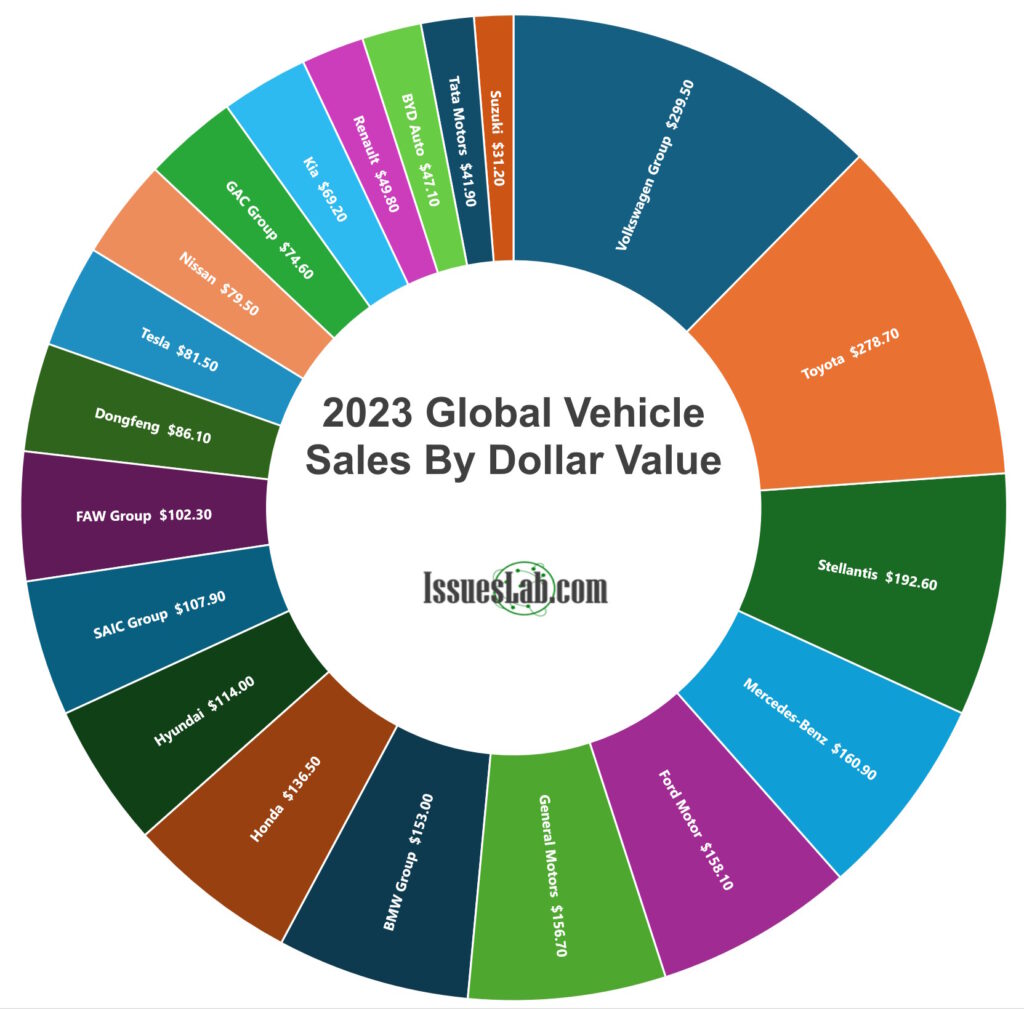
Total Auto Sales Value in 2023
| Rank | Company | Country | 2023 Sales in Billion of USD$ |
| 1 | Volkswagen Group | Germany | $299.50 |
| 2 | Toyota | Japan | $278.70 |
| 3 | Stellantis | Netherlands | $92.60 |
| 4 | Mercedes-Benz | Germany | $160.90 |
| 5 | Ford Motor | United States | $158.10 |
| 6 | General Motors | United States | $156.70 |
| 7 | BMW Group | Germany | $153.00 |
| 8 | Honda | Japan | $136.50 |
| 9 | Hyundai | South Korea | $114.00 |
| 10 | SAIC Group | China | $107.90 |
| 11 | FAW Group | China | $102.30 |
| 12 | Dongfeng | China | $86.10 |
| 13 | Tesla | United States | $81.50 |
| 14 | Nissan | Japan | $79.50 |
| 15 | GAC Group | China | $74.60 |
| 16 | Kia | South Korea | $69.20 |
| 17 | Renault | France | $49.80 |
| 18 | BYD Auto | China | $47.10 |
| 19 | Tata Motors | India | $41.90 |
| 20 | Suzuki | Japan | $31.20 |


2 Comments
Braking Point: Nissan’s Sales Continue Plunge – IssuesLab.com · March 23, 2024 at 3:48 pm
[…] 2024). The drop is explained away by Nissan executives as being caused by Chinese New Year, but two Nissan statistics also caught our attention and made us wonder how Nissan is going to […]
Tesla Hackers Rewarded with Free Model 3 & Hefty Bug Bounty for Taking Full Control – IssuesLab.com · March 23, 2024 at 3:49 pm
[…] Tesla considers itself to be a tech company first and a car company second . As a result, they have a robust bug bounty program that rewards hackers for finding flaws in their code. Much to the surprise of many Tesla fanboys, Tesla does frequenty pay these whitehat hackers, because they find serious bugs. […]