but we didn’t really have a grasp on scale. How big is the global oil market and where major oil producing countries like Canada, Iraq, Mexico and Venezuela lie in the great oil bed? This turned out to be a much trickier question to answer than you might think.
As we explained in our article Why Is Gas So Cheap Right Now? … and it isn’t Because of COVID-19 the real issue is an over production by Russia and Saudi Arabia as they aggressively fight for dominance. So the numbers are both changing rapidly and often fictionalized by a countries official reporting to serve their own ends.
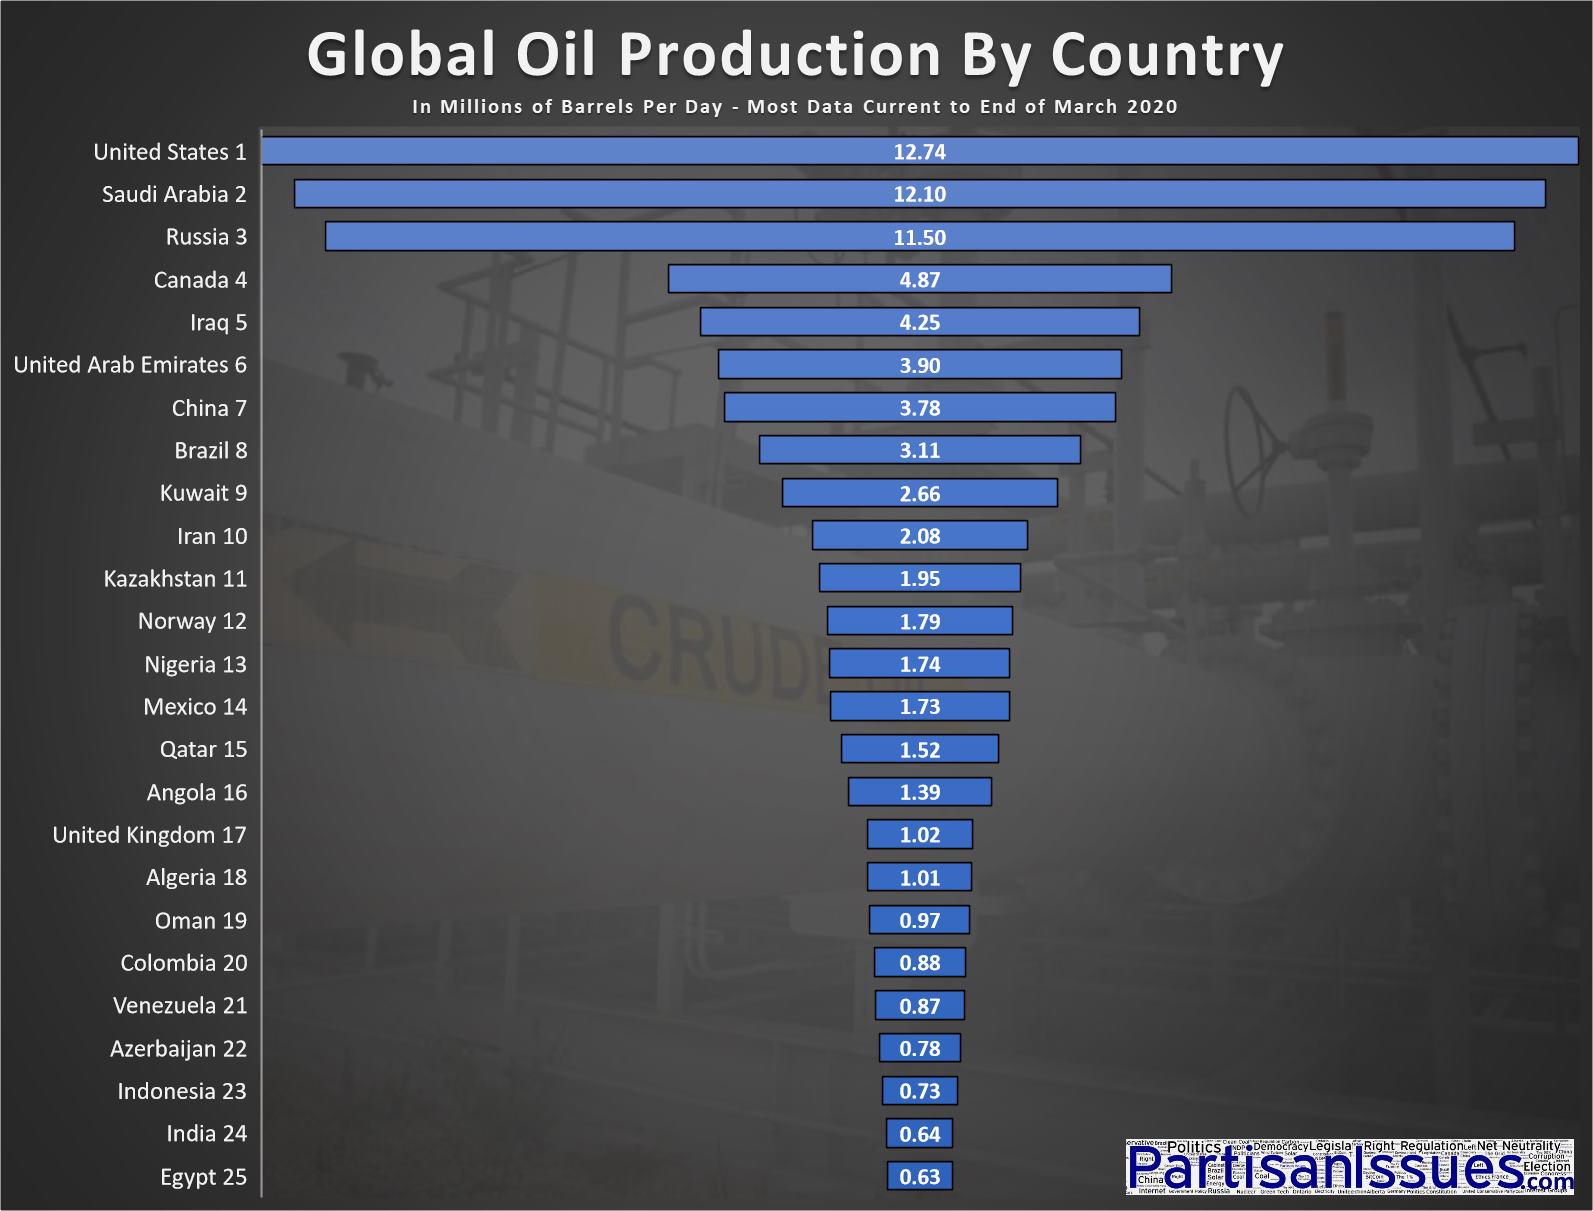
There are many proxies to estimate the real amount of oil that is being produced, like tanker shipments, satellite imagery analysis, and verifiable purchases so we started with January 2020 data from TradingEconomics.com and then updated it with March / April 2020 data from other reliable sources like Bloomberg, the IEA and the Canadian Energy Regulator to develop this chart.
CLICK TO EXPAND GRAPHIC
| Rank | Country | Estimated mb/d | Date of Data |
| 1 | United States | 12.74 | 20-Jan |
| 2 | Russia | 12.10 | 20-Apr |
| 3 | Saudi Arabia | 11.50 | 20-Mar |
| 4 | Canada | 4.87 | 19-Dec |
| 5 | Iraq | 4.25 | 20-Feb |
| 6 | China | 3.90 | 20-Apr |
| 7 | Brazil | 3.78 | 19-Dec |
| 8 | United Arab Emirates | 3.11 | 19-Dec |
| 9 | Kuwait | 2.66 | 20-Feb |
| 10 | Iran | 2.08 | 20-Feb |
| 11 | Kazakhstan | 1.95 | 19-Dec |
| 12 | Norway | 1.79 | 19-Dec |
| 13 | Nigeria | 1.74 | 20-Feb |
| 14 | Mexico | 1.73 | 19-Dec |
| 15 | Qatar | 1.52 | 19-Dec |
| 16 | Angola | 1.39 | 20-Feb |
| 17 | United Kingdom | 1.02 | 19-Sep |
| 18 | Algeria | 1.01 | 20-Feb |
| 19 | Oman | 0.97 | 19-Dec |
| 20 | Colombia | 0.88 | 19-Dec |
| 21 | Venezuela | 0.87 | 20-Feb |
| 22 | Azerbaijan | 0.78 | 19-Dec |
| 23 | Indonesia | 0.73 | 19-Dec |
| 24 | India | 0.64 | 19-Dec |
| 25 | Egypt | 0.63 | 19-Dec |
This website uses cookies.